RDS Monitoring

- Common metrics
- CPU, RAM, disk space consumption, Network traffic, DB Connection, IOPS metrics
- Native logs / extensions
- e.g. pgaudit extension in PostgreSQL for auditing (DML, DCL, DDL, etc)
- Manual Monitoring Tools
- RDS console (DB Connections, R/W ops, storage consumption, memory utilization, N/W traffic)
- AWS Trusted Advisor (cost optimization, security, fault tolerance, performance improvement checks)
- CloudWatch (service health status etc.)
- Automated Monitoring Tools
- RDS event notifications
- Database logs (can be exported to CloudWatch Logs)
- CloudWatch (Metrics /Alarms / Logs)
- Enhanced Monitoring (real-time)
- Performance Insights
- RDS Recommendations
- CloudTrail (captures all RDS API calls, can be viewed in CloudTrail console or delivered to an S3 bucket)
- Up to 90 days of your account activity can be viewed in CloudTrail console (can create a trail to deliver the audit logs to S3)
RDS Notifications / Event subscriptions

- Available within the RDS console
- Allows you to create CloudWatch alarms to notify you whenever certain metric data crosses a threshold
- You can send alarm notifications to an SNS topic (email / SMS)
- You can also subscribe to RDS events
- Event sources can be snapshots, instances, security groups, parameter groups, clusters, cluster snapshots, etc.
- Events like DB instance creation, deletion, availability (shutdown / restart), backup, recovery, failover, failure, backtrack, config change etc.
RDS Recommendations
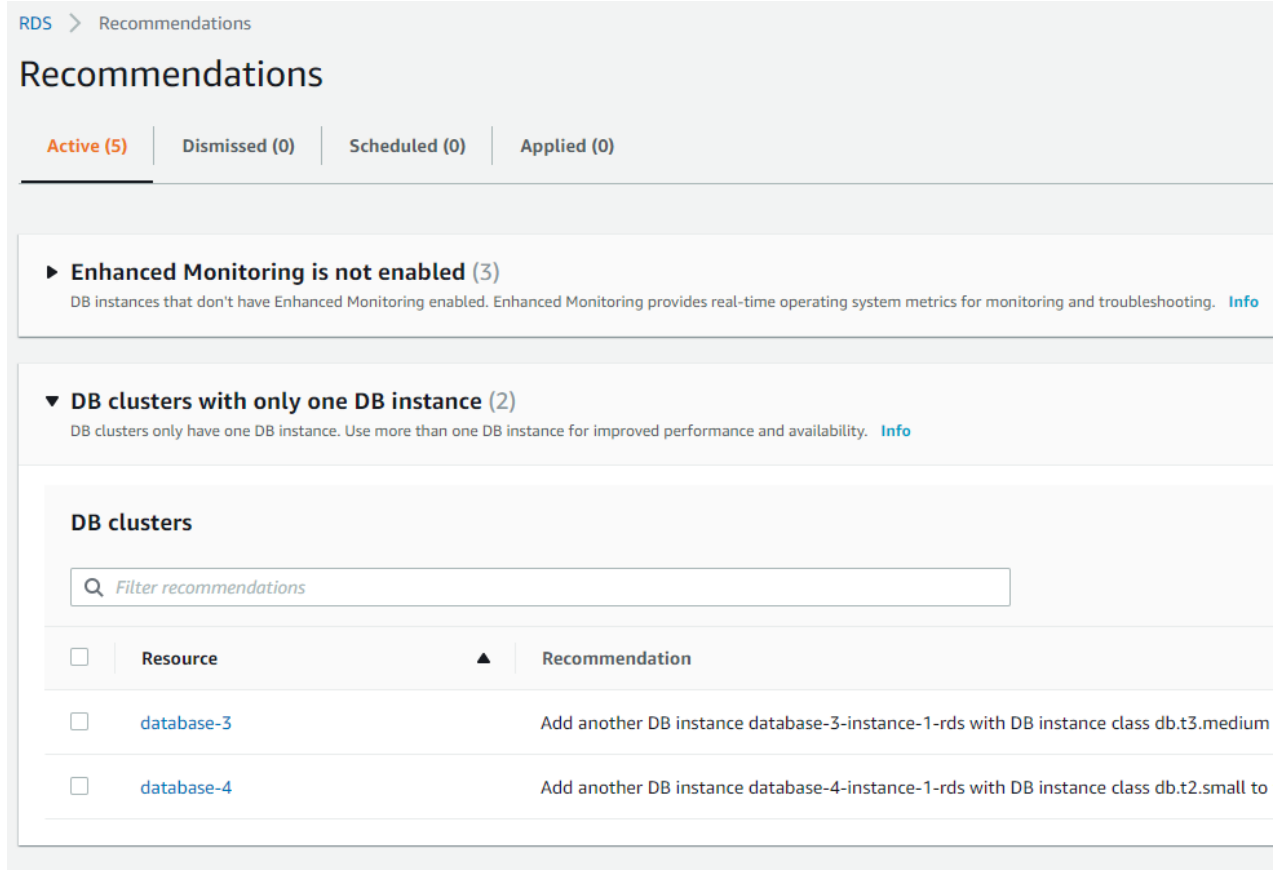
- Periodic automated suggestions for DB instances, read replicas, and DB parameter groups
RDS Logs

- View / watch / download DB logs from the RDS console
- Can export logs to CloudWatch Logs (log types vary by DB engine)
- CloudWatch Logs never expire. To expire them, set log group retention policy (1 day - 10 yrs)
- Logs are accessible from RDS console even if you disable log export to CloudWatch Logs
- Log types that can be exported to CloudWatch Logs
- Alert log - Oracle
- Audit log - Oracle, MariaDB, MySQL (must use option group with MARIADB_AUDIT_PLUGIN option for MariaDB and MySQL to audit database activity)
- Listenr log - Oracle
- Trace log - Oracle
- Error log - SQL Server, MariaDB, MySQL
- Postgresql log - PosgreSQL (contains audit logs)
- Upgrade log - PostgreSQL
- General log - MariaDB, MySQL
- Slow query log - MariaDB, MySQL
Exporting AWS RDS logs to S3

- RDS database log files can be accessed via RDS console, CLI or API
- Transaction logs cannot be accessed
- You can export log data from CloudWatch Logs to S3 by creating an export task in CloudWatch (create-export-task CLI command)
- Log files can also be downloaded using the RDS API and uploaded to S3 (using Lambda or AWS SDK)
RDS Enhanced Monitoring

- To analyze real-time OS level metrics (CPU / memory usage etc.)
- To monitor different processes or threads that are using the CPU
- Helps identify performance issues
- Increased granularity of 1 to 60 seconds
- 1, 5, 10, 15, 30 or 60 seconds
- Requires an agent to be installed on the DB server to collect metrics
RDS Monitoring in CloudWatch

RDS Performance Insights

- Offers visual dashboard for performance tuning, analysis and monitoring
- Monitors DB load for the instance (if the instance has multiple DBs, you'll see aggregated metrics)
- DB load - average number of active sessions (AAS - average active session)
- Performance problems will appears as spikes in the DB load graph
- Helps identify performance bottlenecks, expensive SQL statements, etc

- You can visualize the DB load, filter it by waits / SQL / hosts / users
- Waits - wait state for CPU, IO, Lock etc.
- SQL - SQL Statements
- Hosts
- Users
- Identify slow queries (top SQL), locks

- Use AAS(Average Active Session) and Max CPU together for analysis
| AAS < 1 | DB is not blocked |
| AAS = 0 | DB is idle, Problems are in the App not DB |
| AAS < # of CPUs | CPU is available |
| AAS > # of CPUs | Performance issues |
| AAS >> # of CPUs (spikes or frequent occurrence) | Performance bottleneck |
https://www.youtube.com/watch?v=RyX9tPxffmw
RDS Performance Insights
Can also be used for sizing

- If CPU load is significantly less than Max CPU => oversized

- If CPU load > Max CPU => Undersized
RDS Performance Insights

- However over wait state legend to see description of any particular state
- IO:XactSync - is a wait state in PostgreSQL where a session is issuing COMMIT / ROLLBACK and RDS Aurora is waiting for storage to acknowledge persistence
- Can arise when there is very high rate of commits on the system.
- modify your application to commit transactions in batches
- If seen along with high CPU waits, if often means DB load exeeds allocated vCPUs
- Reduce those workloads or scale up to higher CPUs
- Common wait events (can vary by DB engine)
Amazon Aurora MySQL reference - Amazon Aurora
docs.aws.amazon.com
Amazon Aurora PostgreSQL reference - Amazon Aurora
Thanks for letting us know this page needs work. We're sorry we let you down. If you've got a moment, please tell us how we can make the documentation better.
docs.aws.amazon.com
RDS Performance Insights

- Automatically publishes metrics to CloudWatch
- Easily integrates with on-premise or third-party monitoring tools
- Two options for access control
- Use AmazonRDSFullAccess policy, or
- Use a custom IAM policy and attach it to the IAM user or role
CloudWatch Application Insights
- For .NET and SQL Server
- Also supports DynamoDB tables
- Identifies and sets up key metrics, logs, and alarms for SQL Server workloads
- Uses CloudWatch events and alarms
- Useful for problem detection, notification and troubleshooting
RDS on VMware

- Lets you deploy RDS DBs in on-premise VMware environments (VMware vSphere)
- Same user interface as in AWS
- Supports MySQL, PostgreSQL, and SQL Server
- Fully managed DBs
- Uses health monitoring to detect unhealthy database instances and automatically recovers them
- Support manual and automatic backups with PITR
- Can use CloudWatch for monitoring
Demo
'AWS Database > AWS RDS & Aurora' 카테고리의 다른 글
| [AWS Certificate]-Amazon Aurora (0) | 2022.01.06 |
|---|---|
| [AWS Certificate]-Amazon RDS Good thing to know (0) | 2022.01.06 |
| [AWS Certificate]-Amazon RDS Replication & DR (0) | 2022.01.06 |
| [AWS Certificate]-Amazon RDS Backup & Restore (0) | 2022.01.05 |
| AWS RDS Aurora 스토리지 및 IO 비용 계산 (0) | 2021.12.20 |


